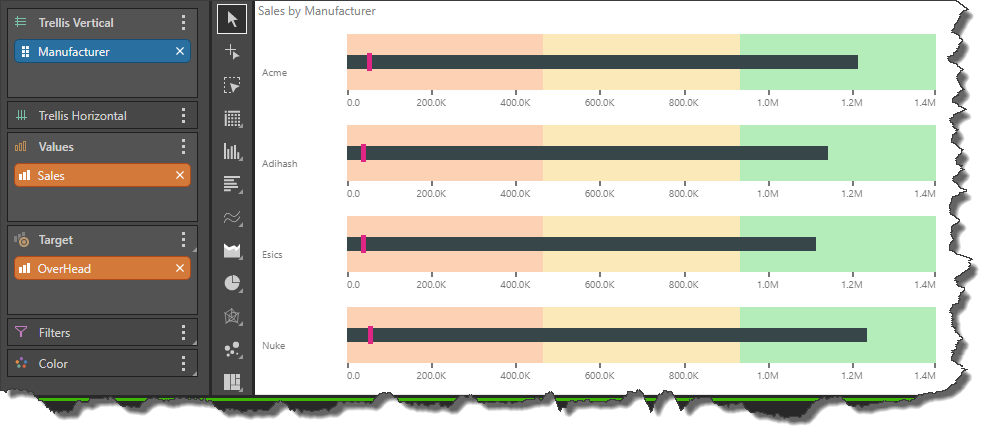
KPI charts are used to visualize your KPIs as a gauge or bullet chart. This involves assigning actual, target, and status values; these values can be assigned on the fly in Discover, or they can be hardcoded from Formulate. In the latter scenario a custom KPI calculation is produced, which can then be added to the drop zones.
There are two kinds of KPI charts: